Xdebug is a PHP extension which provides debugging, profiling, code coverage, stack traces and many other capabilities.
In this succinct tutorial, I will show us how to set up Xdebug that ships with XAMPP in PhpStorm. See the steps below.
- Open up
php.ini(located atC:\path-to-xampp\php) for editing. - Search for
[XDebug]and un-comment all its entries.zend_extension = "C:\xampp\php\ext\php_xdebug.dll" xdebug.profiler_append = 0 xdebug.profiler_enable = 1 xdebug.profiler_enable_trigger = 0 xdebug.profiler_output_dir = "C:\xampp\tmp" xdebug.profiler_output_name = "cachegrind.out.%t-%s" xdebug.remote_enable = 0 xdebug.remote_handler = "dbgp" xdebug.remote_host = "127.0.0.1" xdebug.trace_output_dir = "C:\xampp\tmp" - You will need to restart Apache at this point.
- On PhpStorm, open the
Settingsby choosing File > Settings or ctrl + alt + S, then click the PHP menu. - On the PHP page, choose your PHP installation from the Interpreter drop-down list and click the Browse button
 next to the field.
 - The Interpreters dialog box would open and shows the version of the selected PHP installation and Xdebug & its version. If
Debugger: Not installedis shown instead, click the reload icon close to PHP home input field.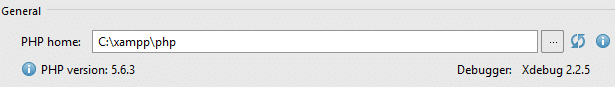
- Hit the Apply and Ok buttons and you should be good to go.